Altmetrics is a term that means alternative metrics. Metrics are the things that are measured. For researchers, the things that are typically measured are the number of citations in a journal article. These citations are usually for printed articles or books. However, in today’s digital age, citations also include electronic materials. Not only that, with the abundance of social media, many researchers now use these sites to promote and discuss journal articles. Altmetrics is a way of collating these mentions as well as other methods such as number of downloads, number of clicks etc. to provide evidence on the impact any particular article may have.
For this lab exercise we used the website altmetric.com to create datasets. The first thing we had to do was create an account. Thanks to Mr. Preigo, we have free access until the 15th of January, 2015. So we can continue to use this site to create more datasets until January, that is.The instructions were simple.
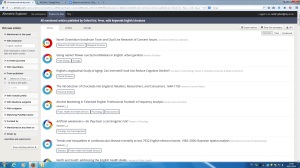
The Altmetric website collected information such as the number of mentions on different social media sites and gave each article a score based on that number. The picture above is an example of what the score looked like on the website. The different colours represent the social media platform. In the above example, the red represents news outlets, the yellow, blogs and the blue, Twitter. The number comes from a complex algorithm that I can’t follow because I am not a mathematician. Once you select the parameters of the articles you want to see, Altmetric.com gives you a result that looks like this:
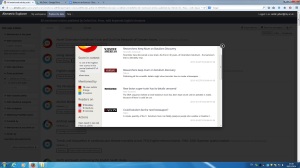
Then you can click on the circle and you get a break-down of the colours and more information on the sites that mention the article.
For this exercise, we used the parameters of all particles published by Cambridge University Press that were mentioned on Twitter and on news outlets only. We saved the results as a workspace. This allows you to keeps the results from the same parameters so you can come back and look at it later. In the workspace, you can export the results as a spreadsheet that you can open with Excel. This was similar to the previous exercise where we used the TAGS application to extract tweets into a Google spreadsheet. However, it did not take as long. For the TAGS exercise, it was using the Google API to run scripts to display the data. This website simply allowed us to download the data as a .cvs file.
Putting the information in a spreadsheet is very convenient for both quantitative and qualitative analysis. You can count the articles in this case, by subject or rank them according their mentions on Twitter or the news outlets. You can easily make graphs to show your data. You can get qualitative analysis as well. You can infer from which subjects are discussed most on different platforms, reasons why that is so. Perhaps it might not be the different subjects, it might be the publisher. Some publishers may allow their journal articles to be more easily discussed using social media. These are questions that may be easier to answer using the Altmetic.com site.


